Analytics Dashboard
The Analytics Dashboard serves as the central nervous system for freelancers on the ICPWork platform. It is a sophisticated, data-driven command center designed to provide users with a comprehensive, real-time overview of their professional activities, financial performance, and market standing. This section of the application is not merely a static display of numbers; it is an interactive and dynamic tool engineered to empower freelancers with actionable insights, enabling them to make informed decisions, optimize their strategies, and ultimately, maximize their success in the decentralized freelance economy. The design philosophy behind the Analytics Dashboard is rooted in the principles of transparency, clarity, and empowerment. It aims to demystify the complexities of freelance business management by presenting key performance indicators (KPIs) in an intuitive and visually engaging manner. By consolidating critical data points into a single, cohesive interface, the dashboard eliminates the need for freelancers to rely on disparate tools and manual tracking methods, thereby saving time, reducing administrative overhead, and allowing them to focus on what they do best: delivering high-quality work.
Strategic Importance
The strategic importance of the Analytics Dashboard within the ICPWork ecosystem cannot be overstated. In the competitive landscape of online freelancing, data is the new currency. Freelancers who can effectively track their performance, understand market trends, and identify areas for improvement are far more likely to thrive. The dashboard is meticulously crafted to provide this competitive edge. It moves beyond simple vanity metrics and instead focuses on providing deep, contextualized insights that are directly tied to a freelancer's career growth and financial well-being. From a high-level summary of total earnings to a granular breakdown of skills distribution and client feedback, every element of the dashboard is designed to answer critical questions that freelancers face daily: How much have I earned? Which of my skills are most in demand? How satisfied are my clients? Where do I stand in comparison to my peers? By providing clear and concise answers to these questions, the dashboard transforms raw data into a powerful tool for strategic planning and professional development.
User Interface (UI) and Key Features
The user interface (UI) of the Analytics Dashboard is a testament to modern, user-centric design principles. It features a clean, uncluttered layout with a harmonious color palette that is both aesthetically pleasing and functional. The use of whitespace is generous, ensuring that the various data visualizations and information modules are easy to distinguish and digest. The typography is crisp and legible, with a clear hierarchy of headings and text that guides the user's eye through the different sections of the page. The overall impression is one of professionalism and sophistication, reflecting the cutting-edge nature of the ICPWork platform itself. The dashboard is also designed to be responsive, ensuring a seamless and consistent experience across a wide range of devices, from large desktop monitors to tablets and smartphones. This mobile-first approach is crucial in today's on-the-go world, allowing freelancers to stay connected to their business and monitor their performance from anywhere, at any time.
Summary Header
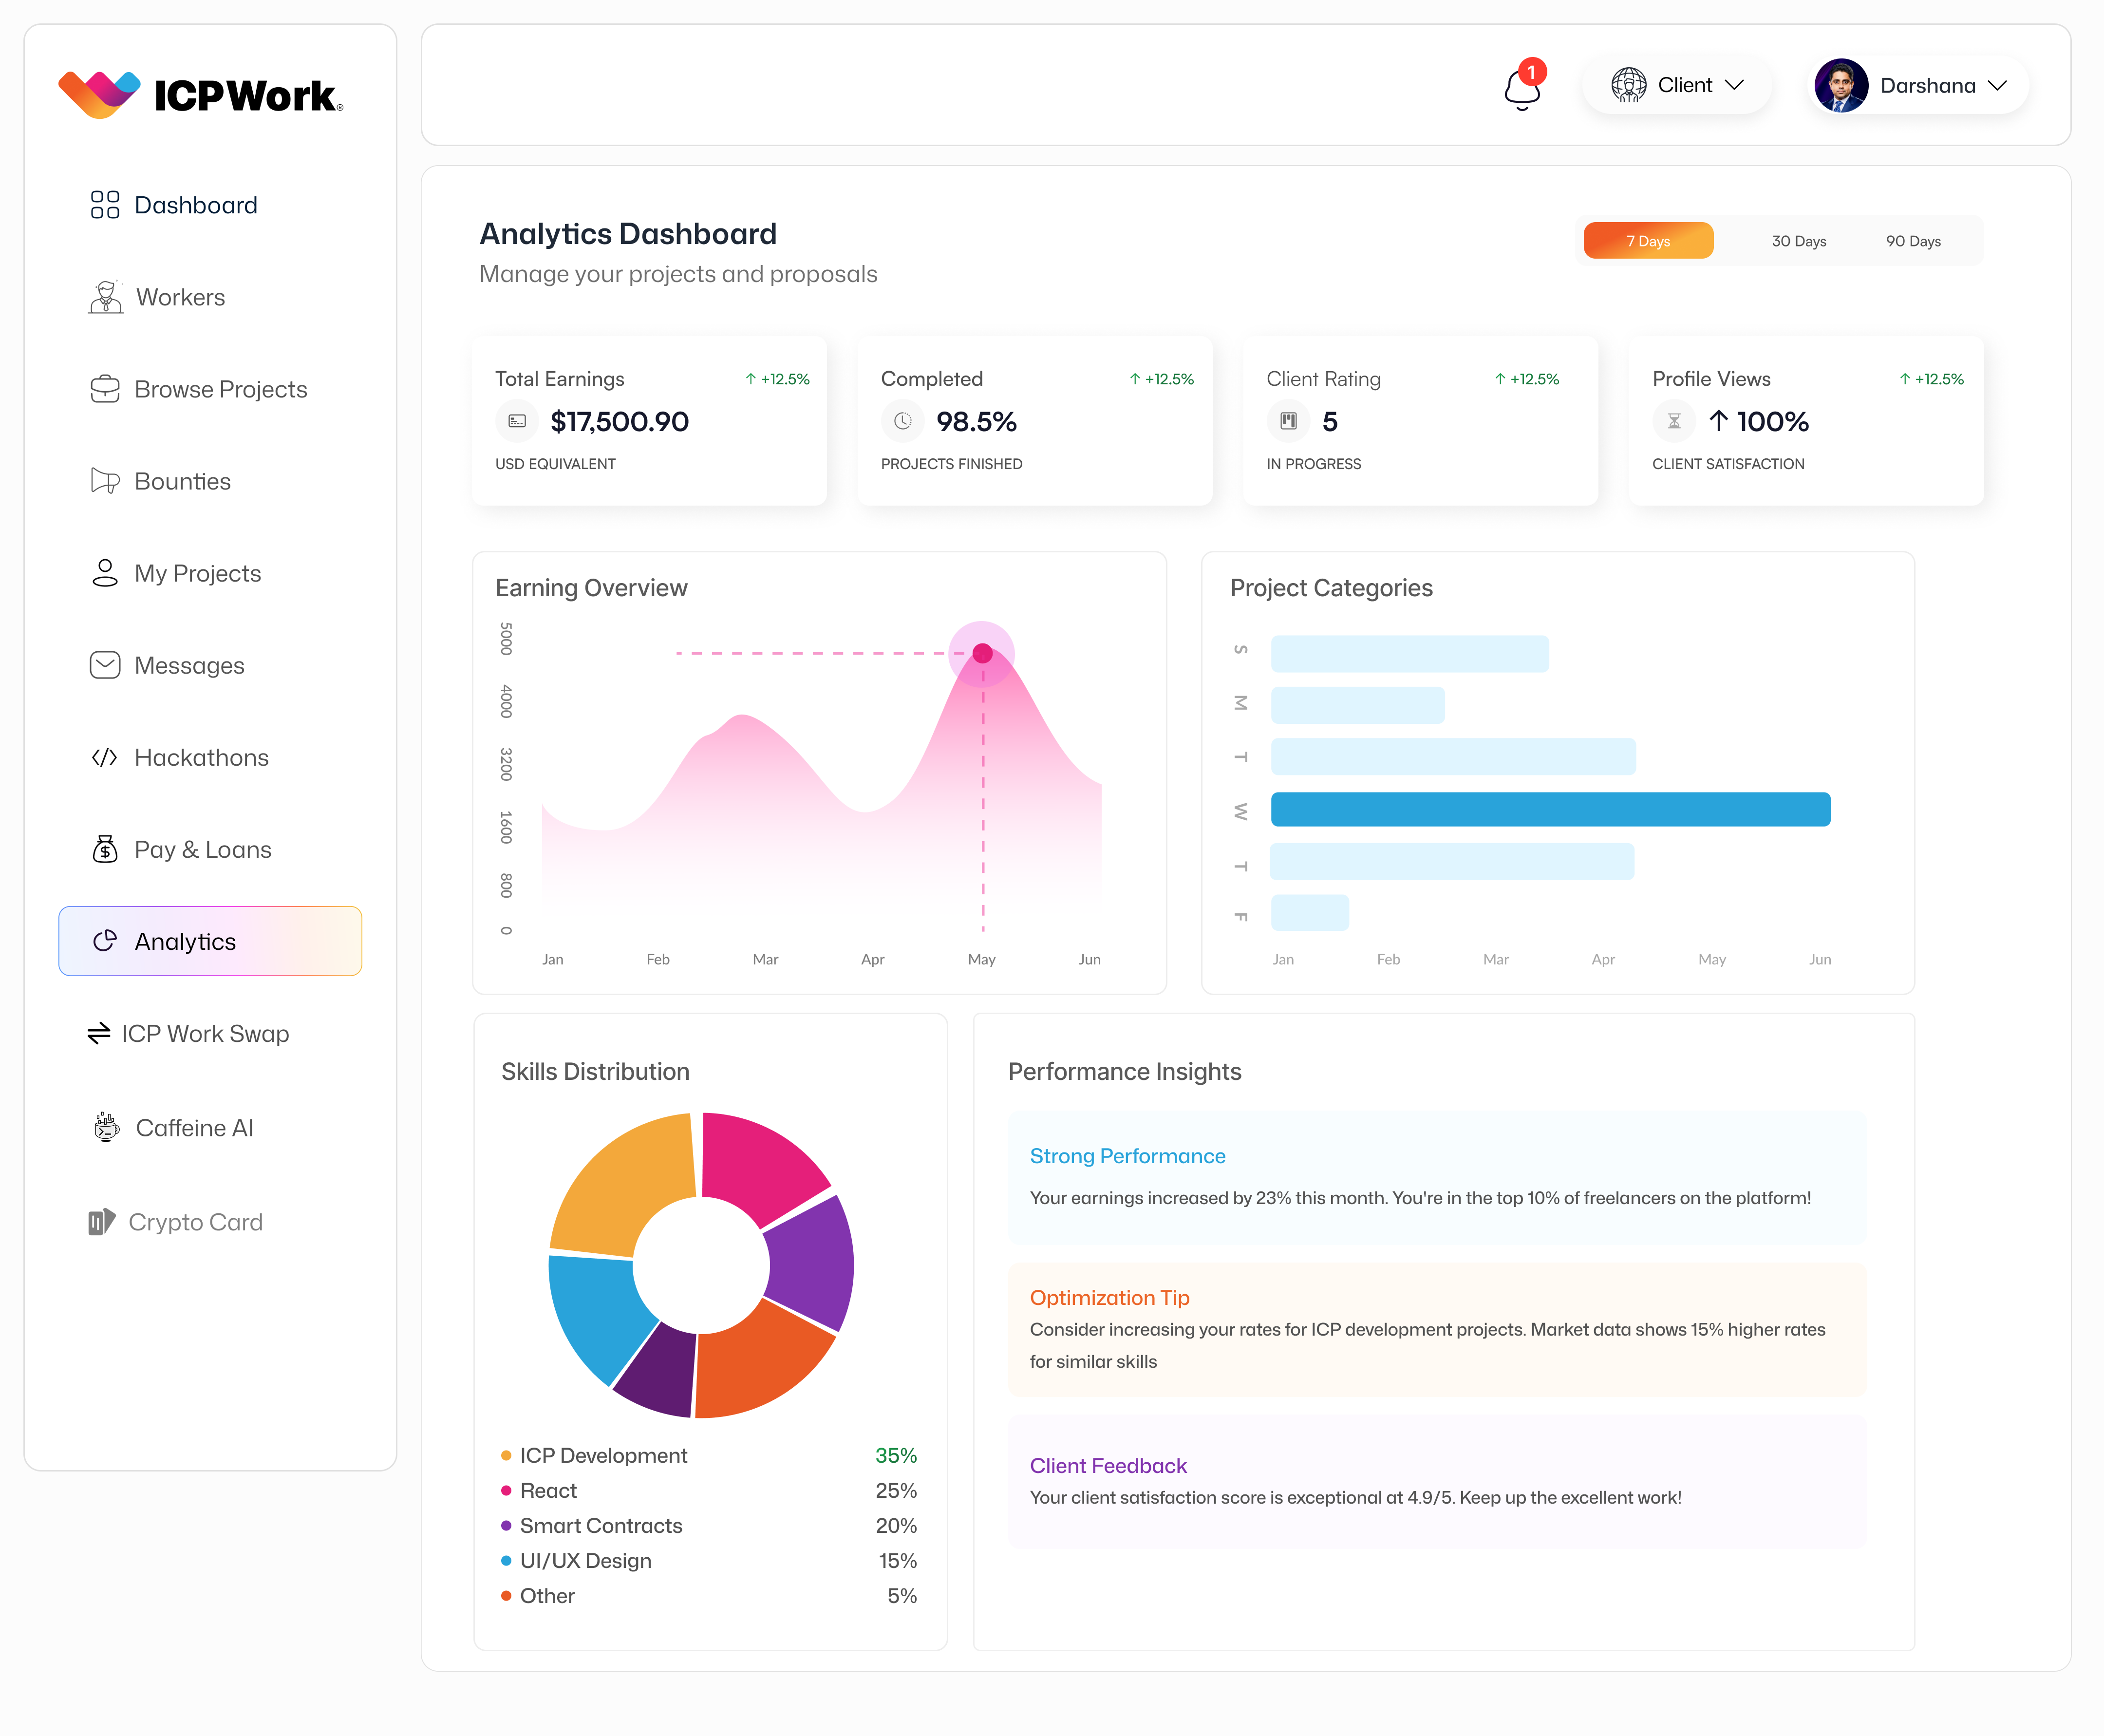
At the very top of the dashboard, a prominent header provides a high-level summary of the most critical performance metrics. This section includes key figures such as 'Total Earnings,' 'Completed Projects,' 'Client Rating,' and 'Profile Views.' Each of these metrics is accompanied by a percentage change indicator (e.g., '+0.00%'), providing immediate context on performance trends. This at-a-glance summary allows freelancers to quickly gauge their overall standing and identify any significant shifts in their business trajectory. For instance, a rising 'Client Rating' coupled with an increase in 'Profile Views' indicates growing client satisfaction and market visibility, which are crucial for attracting new opportunities. The 'USD Equivalent' for 'Total Earnings' provides a clear, universally understood financial benchmark, bridging the gap between cryptocurrency earnings and traditional financial understanding. This immediate feedback loop is vital for freelancers to understand the impact of their efforts and adjust their strategies accordingly.
Earning Overview
Beneath the summary header, the dashboard presents an 'Earning Overview' in the form of a line graph. This visualization tracks the freelancer's earnings over time, typically displaying trends across periods like '7 Day,' '30 Days,' or '90 Days,' which can be selected by the user. The line graph, with its gentle curves and shaded area, provides a clear visual representation of earning fluctuations, allowing freelancers to identify peak periods, seasonal trends, or the impact of specific projects on their income. For example, a sharp upward trend might correlate with the completion of a high-value project or a period of increased client engagement. Conversely, a dip might prompt a freelancer to analyze their recent activities and adjust their outreach or bidding strategies. This historical perspective is invaluable for financial planning, goal setting, and understanding the cyclical nature of freelance work. The ability to filter by different timeframes offers flexibility, catering to both short-term tactical adjustments and long-term strategic planning.
Project Categories
Adjacent to the 'Earning Overview' is the 'Project Categories' bar chart. This chart provides a breakdown of the types of projects a freelancer has undertaken, illustrating their specialization and the demand for their skills across different domains. Each bar represents a project category (e.g., 'ICP Development,' 'Frontend,' 'Backend,' 'UI/UX Design'), with its length indicating the volume or value of projects completed within that category. This visualization is particularly useful for freelancers looking to diversify their skill set, identify niche markets, or focus on high-demand areas. For instance, if 'ICP Development' shows a significantly larger bar, it suggests a strong market for those skills and might encourage the freelancer to further specialize or market themselves more aggressively in that area. This data helps freelancers align their offerings with market needs, ensuring they remain competitive and relevant. It also serves as a visual portfolio, showcasing their expertise to potential clients who might view a public version of their analytics.
Skills Distribution
Further down, the 'Skills Distribution' section is presented as a pie chart, offering a proportional breakdown of the freelancer's declared or utilized skills. Each slice of the pie represents a specific skill (e.g., 'ICP Development,' 'React,' 'Smart Contracts,' 'UI/UX Design'), with its size corresponding to the percentage of their work or expertise attributed to that skill. This visual representation is crucial for self-assessment and strategic positioning. It helps freelancers understand their core competencies and identify areas where they might need to upskill or reskill to meet evolving market demands. For example, if 'ICP Development' accounts for 60% of their skills, while 'UI/UX Design' is only 10%, it clearly illustrates their primary area of expertise. This insight can guide their learning path, helping them invest in courses or certifications that enhance their most valuable skills or develop new ones that complement their existing strengths. The pie chart also reinforces the idea of a well-rounded professional, even if specialized, by showing the breadth of their capabilities.
Performance Insights
The 'Performance Insights' module provides qualitative and quantitative feedback, offering personalized tips and recognition. This section typically includes highlights like 'Strong Performance,' which might state, 'Your earnings increased by 20% this month. You're in the top 10% of freelancers on the platform!' Such positive reinforcement is highly motivating and validates the freelancer's hard work. It also provides a benchmark against the broader platform community, fostering a sense of achievement and healthy competition. Below this, an 'Optimization Tip' might suggest, 'Consider increasing your rates for ICP development projects. Market data shows 15% higher rates for similar skills.' This is an example of the dashboard leveraging aggregated market data to provide direct, actionable advice, helping freelancers optimize their pricing strategies and ensure they are compensated fairly for their expertise. Finally, 'Client Feedback' offers a summary of client satisfaction, such as 'Your client satisfaction score is exceptional at 4.9/5. Keep up the excellent work!' This direct feedback is invaluable for building trust and reputation, as it directly reflects the quality of service provided. These insights are not just numbers; they are narratives that guide a freelancer's professional journey.
Navigation and Technical Architecture
The left-hand navigation bar of the ICPWork application is a consistent feature across all sections, providing quick access to various modules. For the Analytics Dashboard, the 'Analytics' tab is highlighted, indicating the user's current location within the application. Other accessible sections include 'Dashboard' (likely a broader overview), 'Workers' (for clients to browse freelancers, or for freelancers to see their peers), 'Browse Projects,' 'Bounties,' 'My Projects,' 'Messages,' 'Hackathons,' 'Pay & Loans,' 'ICP Work Swap,' 'Caffeine AI,' and 'Crypto Card.' This comprehensive navigation system underscores the multi-faceted nature of the ICPWork platform, which aims to be a one-stop solution for all freelancing needs, from project discovery and management to financial services and AI assistance. The intuitive placement of the navigation bar ensures that users can seamlessly transition between different functionalities, enhancing the overall user experience and promoting engagement across the platform's diverse offerings.
From a technical perspective, the Analytics Dashboard is a complex interplay of several ICP canisters. The data displayed on the dashboard is aggregated from various sources, primarily the User Management Canister (for profile views and client ratings), the Project Management Canister (for completed projects and earnings), and potentially an Index Canister that processes and aggregates market data for optimization tips. The 'Earning Overview' graph, for instance, would pull historical transaction data from the Payment Escrow Canister, which records all fund releases and withdrawals. The 'Project Categories' and 'Skills Distribution' charts would derive their data from the freelancer's profile information stored in the User Management Canister and project metadata within the Project Management Canister. The 'Performance Insights' module would likely involve a dedicated Analytics Canister that performs complex computations and comparisons against anonymized platform-wide data to generate personalized feedback and tips. This modular architecture ensures that each piece of data is managed by the appropriate canister, promoting data integrity, security, and scalability. The asynchronous nature of inter-canister communication on ICP allows for efficient data retrieval and aggregation without compromising the performance of individual canisters.
Security and Privacy
The security and privacy considerations for the Analytics Dashboard are paramount. All data displayed is either public (e.g., general market trends) or private to the individual freelancer. Access to personal earnings, client ratings, and project history is strictly controlled by the freelancer's Internet Identity. The data aggregation for 'Optimization Tips' and 'Strong Performance' metrics is performed on anonymized and aggregated data, ensuring that individual freelancer data remains private while still providing valuable collective insights. The use of ICP's native security features, such as chain-key cryptography and the reverse gas model, further enhances the trustworthiness of the data presented. Freelancers can be confident that their financial and performance data is accurate, immutable, and protected from unauthorized access or manipulation. The decentralized nature of the platform means that there is no central authority that can unilaterally alter or censor a freelancer's performance history, providing an unprecedented level of data sovereignty.
Conclusion
In conclusion, the Analytics Dashboard is a cornerstone of the ICPWork platform, embodying its commitment to empowering freelancers through data-driven insights. It transforms raw operational data into a strategic asset, enabling freelancers to monitor their progress, identify growth opportunities, and refine their professional trajectory. The dashboard's intuitive design, coupled with the robust technical foundation of the Internet Computer Protocol, ensures a secure, transparent, and highly effective tool for navigating the complexities of the modern freelance economy. It is a powerful demonstration of how blockchain technology can be leveraged not just for financial transactions, but for creating comprehensive, intelligent, and user-centric applications that genuinely add value to the lives of its users. The continuous evolution of this dashboard, driven by community feedback and technological advancements on the ICP, will further solidify ICPWork's position as a leading decentralized freelancing platform.